Contributions
I collaborated with reporter Will Evans to analyze Amazon’s internal injury records and found that the rate of serious injuries for those facilities was more than double the national average for the warehousing industry, and that it appeared to spike during the holidays and the company’s promotional “Prime Day” period. I used Python for analysis and Tableau Desktop for exploratory visualization.1
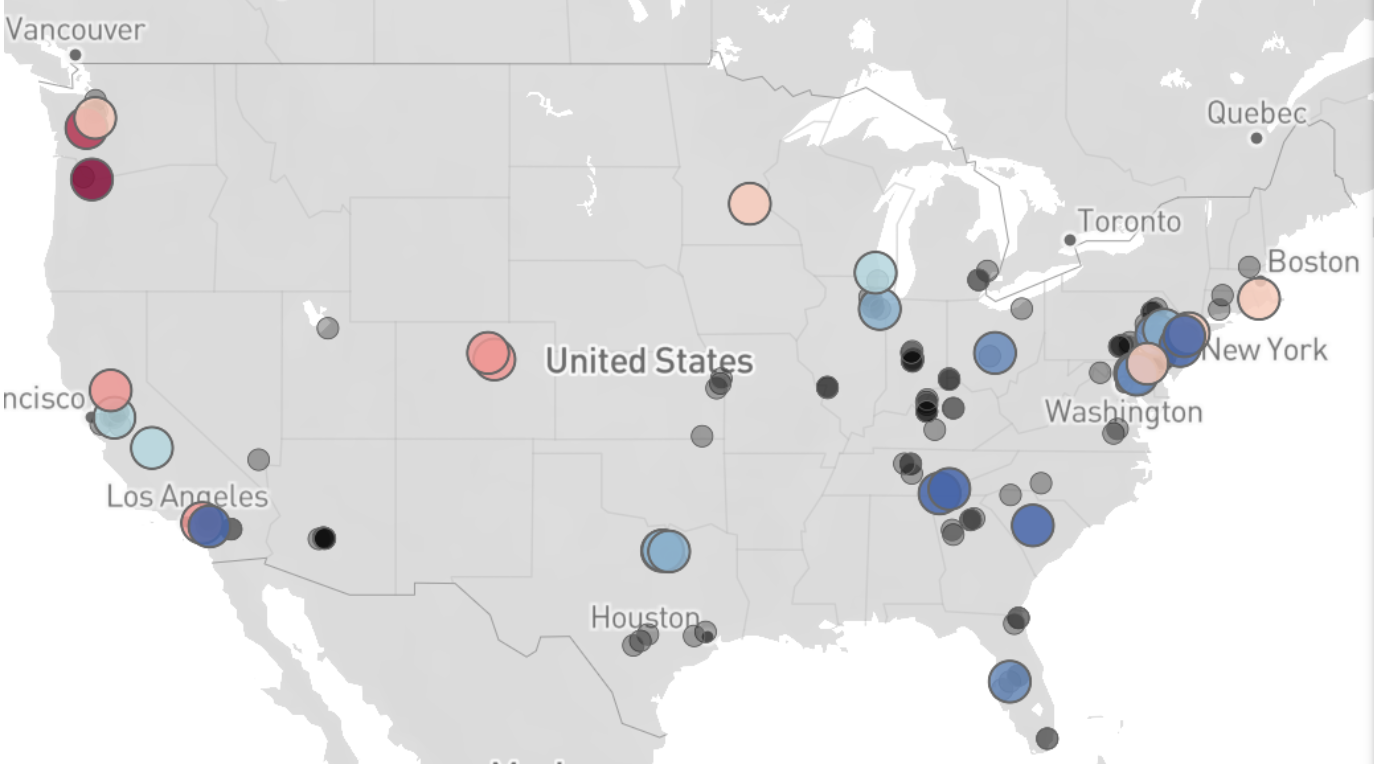
I designed the interactive map through which users could examine injury rates at particular warehouses using Tableau and Omnigraffle, and worked with the developers to deploy it on AWS.
Footnotes
-
The normally $1,000 license is waived for two years for any member of IRE who requests it. ↩